
Instant project feasibility. Verified cost and carbon.
Select any Dutch parcel. See what you can build, if it pays, and the cost in carbon and liveability. Each figure named to its source.
Built at TU Delft.
The problem
The Netherlands cannot build fast enough.
A week of work still prices one scheme.
- Average duration of a housing project, from initiative to handover.
- 10 years
- Homes the national programme set as the delivery target through 2030.
- 900,000
Average duration of a housing project, from initiative to handover.
Homes the national programme set as the delivery target through 2030.
Today that work looks like this.
- 01
Read the rules
Dig through omgevingsplan documents for height, density and what may legally be built.
- 02
Gather the data
Boundaries, buildings and site constraints sit in separate public registers.
- 03
Model the feasibility
Rebuild a spreadsheet from scratch to estimate value, cost and return.
- 04
Decide without the full picture
Bid under a deadline, often before the picture is complete.
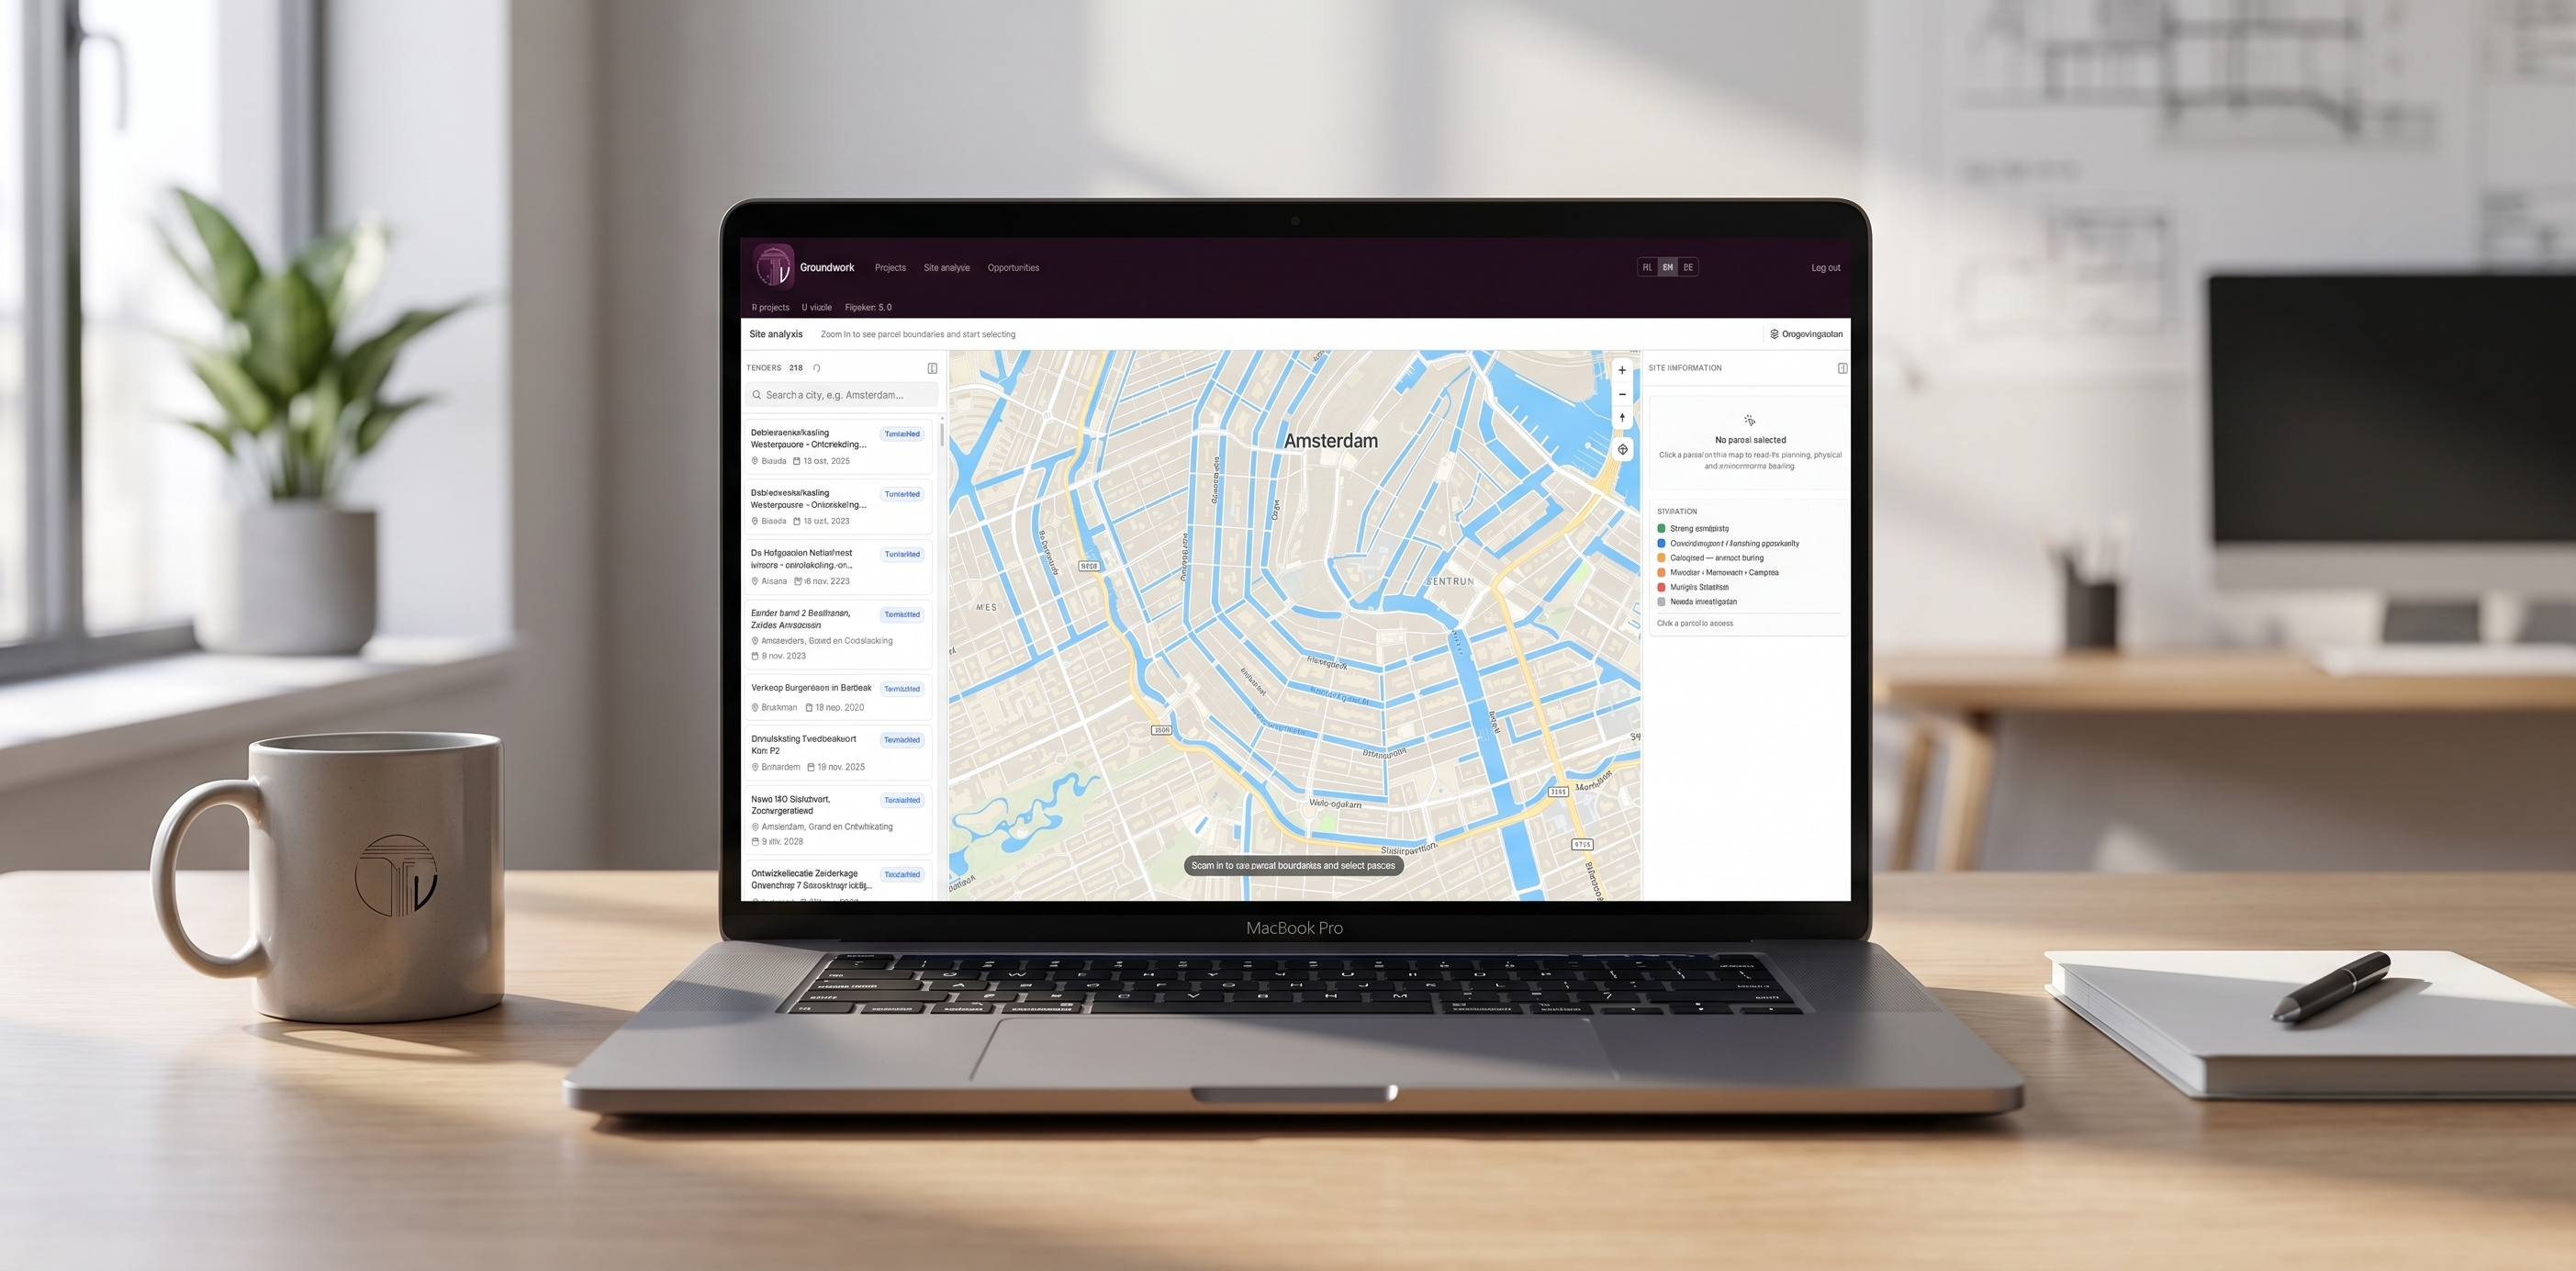
Click a Dutch parcel. The omgevingsplan is read. Every building the rules allow is generated and priced.
The waitlist is growing. Developers are waiting to test once the product is ready. Get access
Carbon
2028
In 2028 carbon is on the energy label.
EPBD recast, Articles 7(2) and 7(5). New buildings over 1,000 m² from 2028. All of them from 2030.
From 1 January 2028 the EU requires whole-life carbon on the energy label of every new building over 1,000 m². From 1 January 2030, every new building. A carbon study today usually arrives after the structure is locked. Then timber versus concrete is no longer a choice.
We show embodied CO₂ per m² BVO on every option at massing, while the structure is still a lever. Bill of quantities by element. A1–A3 cradle-to-gate. Named source.
Transport, construction and demolition are excluded. Where no published basis exists, it shows nothing rather than a guess.
Working toward
Goals we are aligning with, not a certification and not an EU or UN endorsement. Built in the EU, for the European market.
What a plot is worth
Money is one number.
A plot is also what you may build, what it emits, and whether people can live in it under the Bbl. Money and what sits beside money are checked on the same project. Those are the values developers, architects and municipalities will have to defend when EU carbon rules tighten in 2028 and 2030.
We do not invent a social or technology score. Liveability here is the Bbl: rooms, daylight, walk to the stair, open ground. Carbon is A1–A3 embodied. Each figure names its source.
Walkthrough
Parcel to appraisal, in 15 minutes.
Site analysis, massing on the plot, then construction cost, embedded carbon and cash flow.
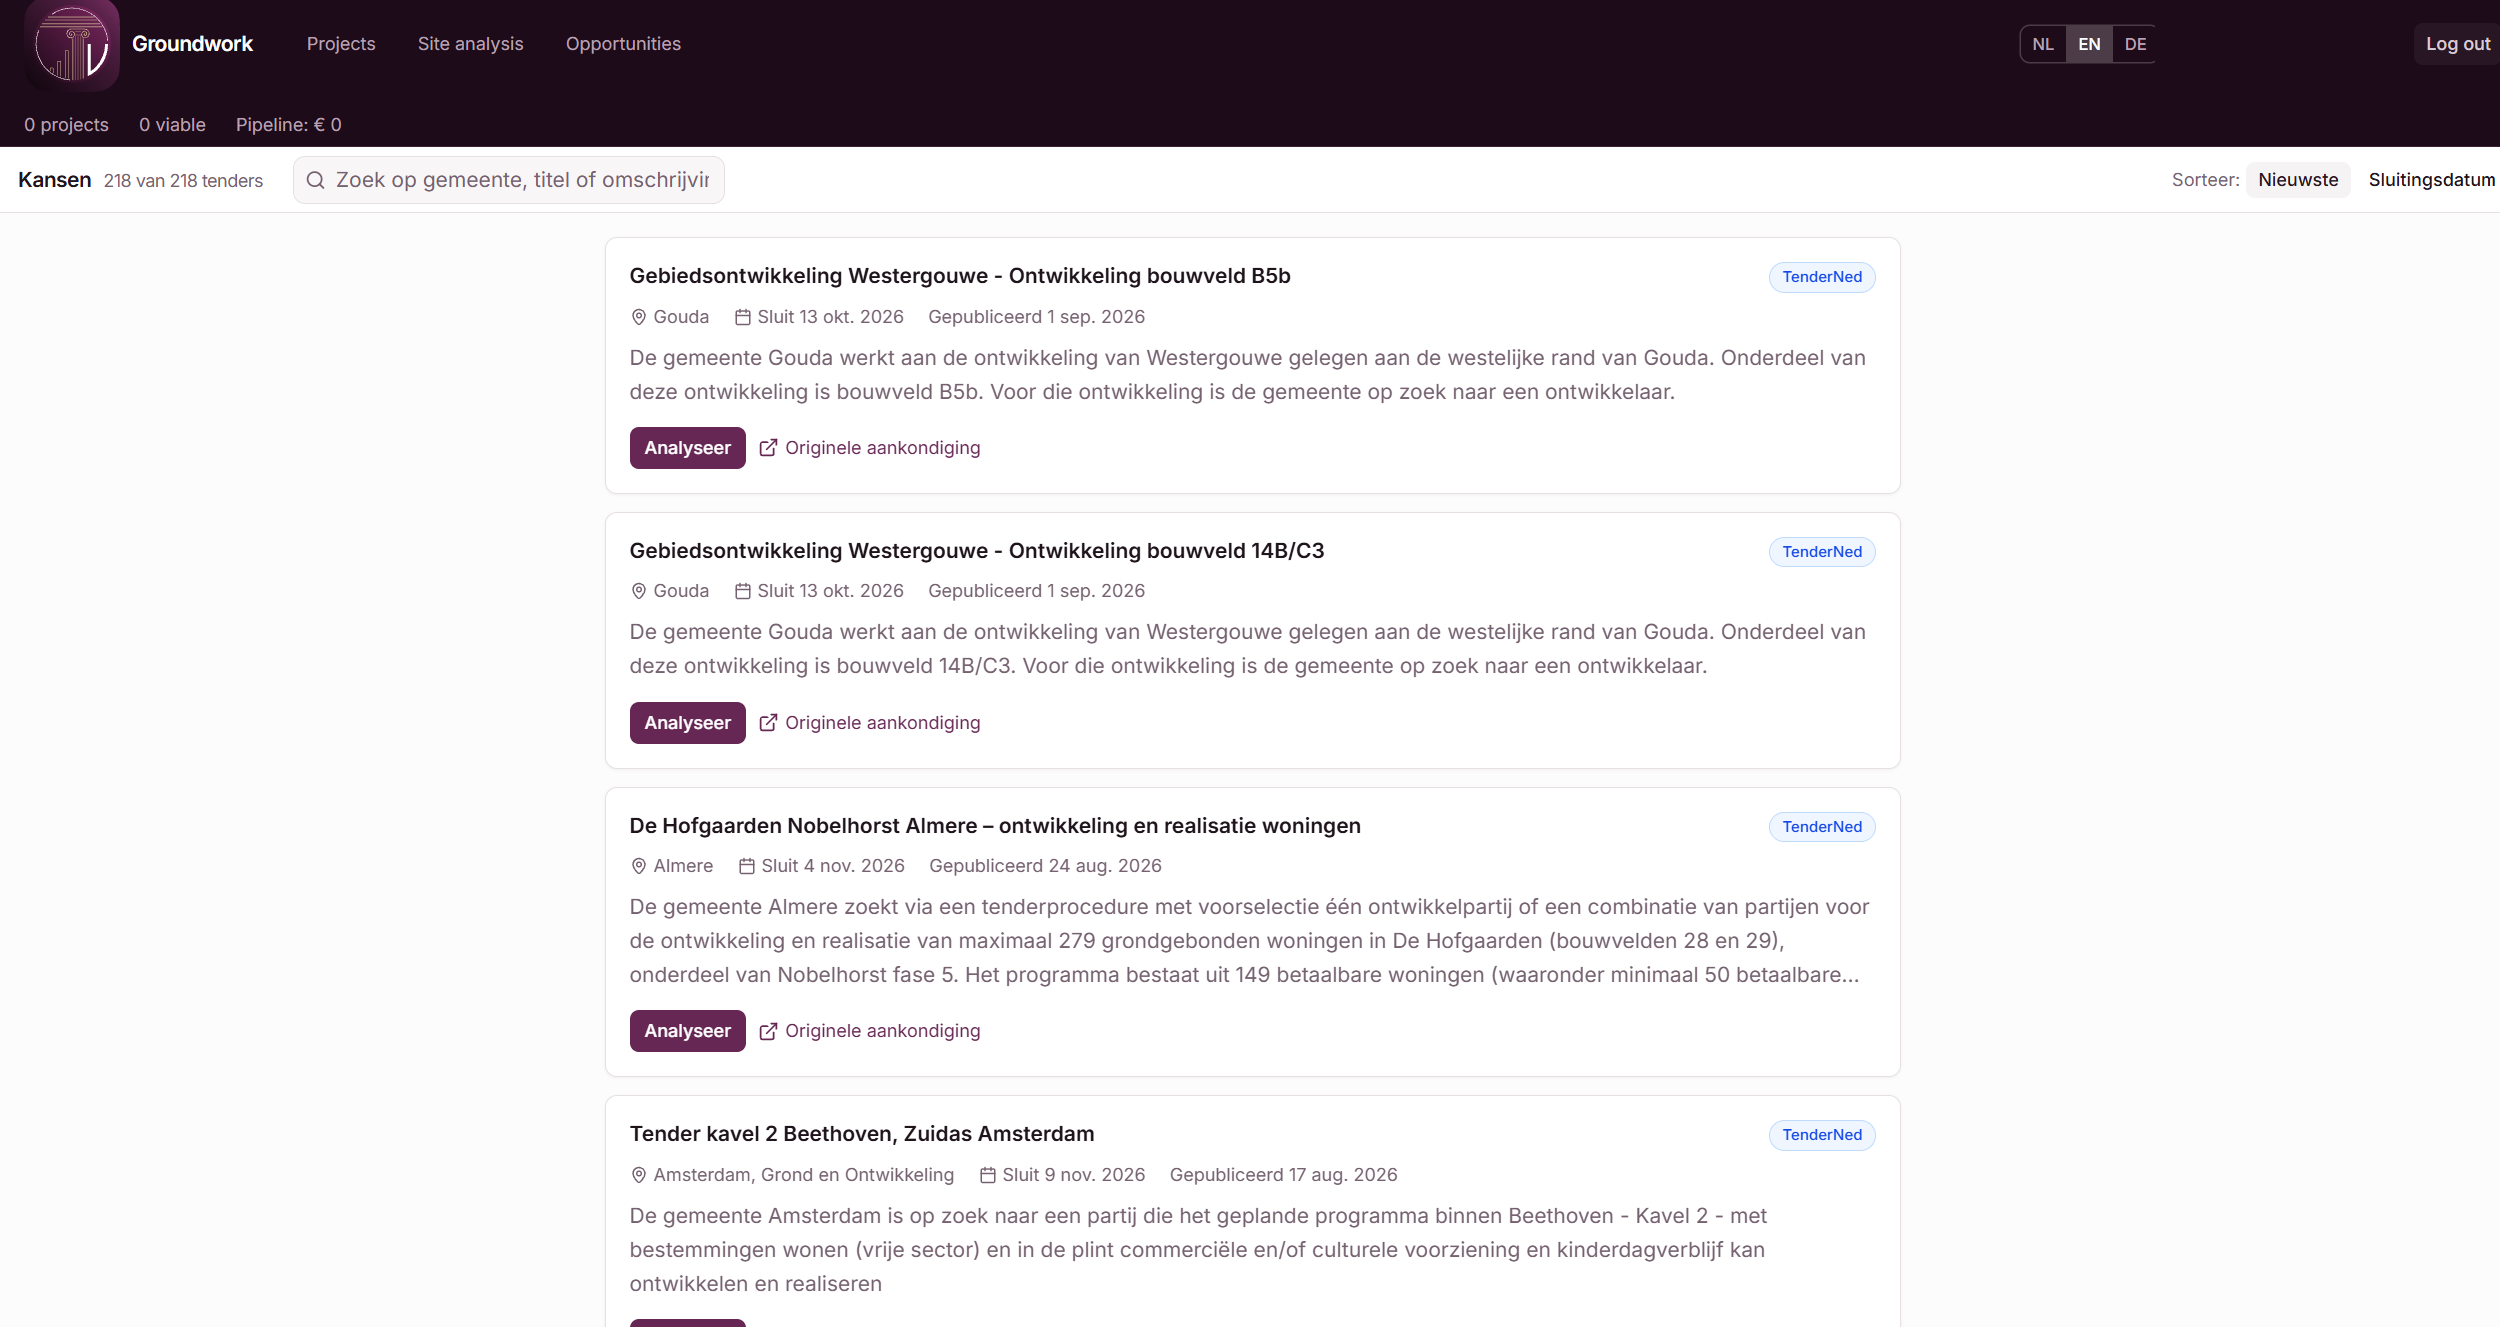
Alerts for public tenders
TenderNed in one list. Open any notice straight into an analysis.
You only ever price one scheme.
See every option that fits. Land value, dwellings, CO₂. Overshoots flagged.
The meeting asks where the number came from.
Residual, margin, IRR. Full cash flow. Each figure named.
Every figure is marked.
Measured and assumed are marked. You keep the judgment.
We mark what is measured and what is assumed. Every rule points to its source. If something does not check out, we say so. Right there. The site, the massing and the evaluation share those same marks, so a number cannot quietly change meaning between steps. Usable-area ratios validated against 600 real storeys, not against our own assumption.
One workflow
- Parcel
- Building
- Numbers
Some of the algorithms in this software have been in use for a long time. What is new, and what sets us apart in the regions we work in, is that they run as one workflow. Data from the site analysis becomes the constraints on the mass model. Data from that model, generated or uploaded, goes straight into the evaluation: financial, environmental, and how liveable the scheme is.
Liveability here is the checks the Bbl already asks for, on the same building: room size, daylight, walk to the stair, open ground. Not a separate quality-of-life score. We do not keep the software in-house and sell you the results. You run it. The aim is that generation from a site, including the parts that learn from real plans, is useful to everyone in property development, not a black box on a consultant’s desk.
The architect should not redraw this.
DXF and IFC4, georeferenced to RD New. Opens in Rhino or Revit in the right place on the map.
- Rhino · DXF
- Revit · IFC4
- Excel
Dutch standards
- NEN 2580
- NEN 2699
- MiniBIM
- Bbl
- A1–A3
- RD New
Reads from
Public Dutch registers. Every rule cites its source.
- Kadaster
- PDOK
- BAG / 3D BAG
- Omgevingsplan (DSO)
- CVDR
- Bouwkostenkompas
- TenderNed
Built for
Developers
Compare plots on money and carbon, before the 2028 label.
Architects
Cost and carbon on the massing. The design stays yours.
Municipalities
Rules, cost and carbon on one scheme. Each traces to its source.
Join the first group.
The waitlist is growing. Developers and advisers are waiting to test once the product is ready.
Work email. We write when a place opens. No newsletter.
Masterpiece, architectural plan generation on top of the Groundwork massing, is in development. It is not available yet. More about Masterpiece